Author Archives: SLCS

Office Ergonomics and Employee Wellness

The comfort and productivity of employees in the workplace are critical factors to consider for efficient facility management operations. However, it’s common for employees to experience discomfort, which can be attributed to the workstation environment and furniture used. As Facility Managers, efforts to ensure individualised workstations tailored to each employee’s needs are crucial. From a facility management perspective, indoor thermal comfort, air quality, lighting, acoustics, floor layout, workstation desk, and chair are all key controllable elements contributing to office ergonomics. To ensure the well-being of employees, it’s essential to establish facility management ergonomics policies, processes, and practices that adhere to industry standards and guidelines such as ISO 9241 (Part 5,6), ISO 7730, EN 15251, ASHRAE, BIFMA – x5-1, OSHA, and LEED. Additionally, it’s crucial to provide personalised workstation adjustments for individuals with special needs to optimise the ergonomics of the office and maintain employee welfare.

Ergonomics Survey

When conducting an ergonomics survey, it’s essential to set clear objectives. Consider occupant-specific job design, physical environmental needs, and cultural nuances. The frequency and target participants of the survey program should be fixed, considering business-specific needs. A comprehensive survey of the physical indoor environment—workstation layout, desk and chair, lighting, sound and noise, indoor air quality, thermal comfort, facility administration, and work culture—will ensure all aspects of ergonomics are considered, leading to more effective corrective and preventive measures.

Survey Analysis

The analysis of the ergonomics survey will reveal issues that contribute to health hazards and low productivity at the workplace. These issues can significantly impact your business, affecting branding image, employee retention, and compliance with local and national safety rules, regulatory guidelines, and global best practices. Addressing these issues is not just a matter of comfort but also a necessity for your employee’s overall health and productivity.


Implementing Corrective and Preventive measures

Corrective and preventive measures to prevent health impacts caused by ergonomics can be broadly classified into engineering and administrative solutions. The key to avoiding these impacts lies in a combination of workplace culture, awareness programs, and engineering solutions tailored to provide ergonomic designs suitable for the job.


Reliability, Availability, and Maintainability Assessment of Data Center

Reliability, Availability, and Maintainability (RAM) Study of Data Centres

Performing a RAMS (Reliability, Availability, Maintainability, and Safety) study is crucial for businesses operating in critical environments. It helps devise operating procedures and emergency response plans that align with business objectives. Facility Managers must work with stakeholders to develop business-level agreements, understand design intent, and identify gaps concerning the governing standards, best practices, design assumptions and estimates. Operations and maintenance teams should conduct a Business Risk Analysis to acknowledge stakeholders and develop a risk management program.

This article provides an overview of the Dependability assessment program for a Data Centre and highlights gaps commonly observed in new and legacy Data Centres alike.

Data Centre Business Context

The criticality of an enterprise data centre is typically evaluated through a comprehensive failure cost impact analysis that considers the immediate financial impact of any failure, the consequential losses that may be incurred, and the long-term effects on the company’s brand reputation. According to surveys conducted by reputable research firms, the average direct cost impact per incident of Data centres ranges from a few hundred thousand to millions of USD. The leading causes of failures in data centres are power interruptions, human error and cooling system failures. It has been reported that approximately 80-90% of Data Centres have experienced severe operational failures in any given five-year tenure, resulting in not just suboptimal end-customer experience but a long-term negative impact on brand image that can be difficult to recover from.

Dependability Assessment

In the context of a data centre, ensuring that the infrastructure is dependable and meets the expected levels of service resilience under normal and emergency operating conditions is crucial. It is also a pathway to significant improvements and cost optimisation. The key dependability attributes, including Reliability, Availability, Maintainability, and Safety, need to be assessed, analysed, and reviewed in collaboration with stakeholders to achieve these benefits.

The dependability of mission-critical infrastructure is contingent upon several factors, including, but not limited to, the locational attributes, architectural and structural features of the building infrastructure, support logistics for operations and maintenance, obsolescence of building systems and subsystems, and the competency of the maintenance team. The Disaster Recovery Business Continuity plan must be tested periodically in a simulated doomsday environment.

It is crucial to ensure that the organisation complies with all relevant statutory and regulatory rules of local and national authorities, in addition to validating assumptions and estimates. This involves obtaining the necessary permits and licenses to operate and complying with all relevant laws and regulations governing its operations.

To ensure that the organisation’s operations run smoothly and efficiently, logistics such as procurement and stock management, local transport, building architectural and structural conditions, and environmental sustainability must be supported. By optimising these logistical processes, the organisation can reduce costs, improve efficiency, and enhance the reliability and dependability of its operations.

Overall, taking a holistic approach to these various aspects of organisational management enables continual improvement of dependability. This helps ensure that the organisation is well-positioned to meet the needs of its customers and stakeholders over the long term.

Workplace Experience Indicators and SDG Targets

The workplace experience is a multi-faceted concept encompassing subjective issues such as job design, interpersonal relationships, workplace cultural and personal attributes, and physical environment. Job design encompasses task assignment, employee autonomy and the complexity of the work, while interpersonal relationships affect communication, teamwork, and morale. The cultural and personal attributes of the workplace include the organisation’s values, norms, and leadership style. Finally, the physical environment, including lighting, temperature, and noise level, significantly impacts the workplace experience.

This article highlights the relationship between workplace experience drivers, the Sustainable Development Goals (SDGs), and their targets. The SDGs comprise 169 universal, multi-dimensional, and time-bound targets for achieving sustainability. By mapping the performance indicators of workplace experience drivers to sustainability targets, organisations can accelerate their progress towards meeting the SDGs.

SDG targets and Workplace Experience Indicators (Example) –

SDG 2 Targets

SDG 3 Targets

SDG 8 Targets

Integrated Facility Management services can potentially impact workplace experience while advancing sustainability goals positively. By aligning operational performance targets with SDGs, FM teams can drive meaningful changes that benefit facility occupants and the broader environment. Embracing innovative IFM practices that integrate sustainability principles is critical to realising these mutual benefits and promoting a more sustainable and enjoyable workplace experience for all stakeholders.

Case Study Customer Satisfaction Survey

Customer Satisfaction Survey program is one of the critical responsibilities of Integrated Facilities Management service providers. The study’s results directly reflect the overall quality, acceptability, and sustainability of the business relationship with the stakeholders and end-customers. Analysing the survey results is essential for identifying gaps in expectations, resource allocation, and associated costs and taking corrective action where necessary.

A corporate office building case study has been presented for general reference purposes. The purpose of conducting an Occupants’ Satisfaction Survey in the second year of beneficial occupancy of a newly constructed corporate building is to identify areas that require intervention from property and service stakeholders based on nuanced expectations and operational needs. The study outlines the approach, objectives, and choice of survey portfolios and analytics. An analysis of the correlation index between Key Performance Indicators (KPIs) and the Net Promoter Score (NPS) was conducted to identify drivers of customer satisfaction. Additionally, a reliability analysis (Cronbach’s alpha) was performed on service scoping, service quality, service cost, customer satisfaction, and customer retention responses collected over three months to establish the statistical appropriateness of the survey data.

  1. Background

A survey was conducted for a newly constructed corporate building designed to accommodate a maximum of XXX full-time employees and serve as a global Data Centre for the business unit. A significant portion of the built-up area is dedicated to amenities such as indoor swimming pools, gymnasiums, sports centres, convention centres, and other facilities. A third-party contractor specialising in integrated facilities management services was awarded a fixed-term contract at a maximum guaranteed price.

2. Objectives

The Customer Satisfaction Survey aimed to gather constructive feedback on the services provided and identify areas for improvement. It also sought insights into the team’s competency, service inter-dependability, available resources, associated costs, and quality perceptions. The results were used to enhance the quality of services and ensure that customers’ needs are being met effectively.

3. Approach to Survey

The survey exercise was designed to comprehensively evaluate the various service elements and sub-elements contributing to the occupants’ overall workplace experience. To ensure the reliability of the results, a combination of transversal and longitudinal survey methodologies was utilised. To gain deeper insights, detailed analytics were used, including reliability and correlation studies of the online and offline surveys.

4.Customer Satisfaction Survey Analytics

The present study aimed to establish a correlation between service line key performance indicators (KPIs) and net promoter scores (NPS), along with a reliability analysis of online survey responses. The primary objective of the reliability study was to assess the survey responses for quality of service, customer satisfaction, costs, and retention rates. Through the survey analysis, we intended to gain a deeper understanding of the factors that influence customer loyalty and identify areas for improvement in service delivery. The results of this study will be instrumental in enhancing the performance of IFM service lines and ensuring a more satisfying customer experience.

Snapshot of analysis

5.Drivers, Challenges, Opportunities, and Strategies

This summary outlines the critical factors for a survey exercise, including the challenges identified in the service level agreement, the opportunities available to the service team, and the strategies developed for an improvement program. The program aims to achieve efficient service delivery, optimise cost, and improve client experience.

The program has assessed the subjective and nuanced feedback of occupants and stakeholders through the Customer Satisfaction Survey. The identified challenges include inadequate budgeting, poor soft skills of the delivery team, and insufficient documentation of scoping service deliverables, which have been prioritised and require immediate attention. On the other hand, opportunities for improvement have been identified, such as leveraging the IFM service team’s familiarity with building systems and sub-systems. Strategies have been developed to enhance the delivery team’s resourcefulness and justify the enhancement in the allocated budget.

6. Survey Outcome and Improvement Program

The Customer Satisfaction Survey exercise was a huge success, achieving primary outcomes that included sanitising the Service Level Agreement with detailed service deliverable inclusions and exclusions, improving the service quality index, optimising costs, enhancing the occupants’ workplace experience, and retaining business. By evaluating customer satisfaction and identifying areas that required improvement, necessary actions were taken to improve the overall experience.

e-Waste Management Challenges and Way-forward

What is electronic waste (e-waste)?

E-waste is a term used to cover all items of electrical and electronic equipment (EEE)  and its parts discarded by its owner as waste without the intent of re-use. (UN University)The UN defines e-waste as any discarded product with a battery or plug. It includes toxic and hazardous substances such as mercury that can pose severe risks to human and environmental health. Electronic waste (e-waste), also known as WEEE (Waste Electrical and Electronic Equipment), includes items containing polychlorinated biphenyls (PCBs), mercury-containing items, CRTs and CRT glass, batteries, and whole and shredded circuit boards classified as ‘Focus R2’ materials by the EPA.

REDUCE, REUSE, RECYCLE

e-waste Collection rate

Focusing on three stages, procurement, use, and end-of-life, can address the challenges and how to manage Electrical and Electronic Equipment (EEE) effectively.

Electronic waste, commonly known as e-waste or WEEE, is still one of the most overlooked aspects of waste management in commercial buildings and industrial units. Despite the growing awareness of its negative impact on the environment and human health, many businesses still need to implement effective strategies to manage and dispose of their electronic waste.

Building Water Sustainability Assessment

Every drop is conserved, a future preserved.

Interesting facts about water use in commercial sectors (buildings and industrial units).

Water efficiency is a pivotal logistics support system indicator for ensuring a sustainable business operating environment. Optimal water usage yields environmental sustainability for the infrastructure within and surrounding business premises. Responsible business administration necessitates policies and goals aligned with sustainability principles.

Background –

In this article, we will be presenting a case study of operational business units located across various states in India belonging to a single corporate entity. The Corporate Office facility in Delhi is a large commercial building. The Corporate facility and other state business units offer employees various amenities like swimming pools, sports centres, and more. Each business unit facility has landscaping, car parking, and technical space for Data Centres. Performance modelling of water-use efficiency was deemed necessary to understand operational needs better, establish performance indicators and develop roadmaps for improvement projects.

Objective –

Align water management with sustainability principles. Pre-audit the preparation of business unit facilities across India for the Sustainability Certification program.

Our approach

  1. Preliminary information was collected from the respective site.

2. The water balance framework of each facility was structured into three levels.

Sourced Water = Water used + Water discharged (wasted)

3. The water efficiency assessment for each facility was conducted based on four end-use indicators.

4. Analysing

During the survey, 90% of the buildings were found to have potential disruptive issues.

5. Water Management Key Performance Indicators

  • Water sourcing and availability
  • Water network availability
  • Water Quality
  • Water-use and re-use intensity
  • Wastewater discharge

6. Reporting


Waste Management – Buildings and Industrial units

The World Bank’s report, “What a Waste 2.0”, provides a staggering statistic: every year, the world generates a whopping 2.01 billion tons of municipal solid waste. Even more concerning is that at least 33% of this waste is not being managed in an environmentally safe manner. This highlights the urgent need for effective waste management practices.

Throughout its operational phase, it is estimated that an office building or industrial unit will produce an average of 0.05 cubic meters of waste per every 10 square meters of floor area (or per person) per week. This waste can come in many forms, such as paper, plastic, food, and electronic waste. Those managing these facilities need to be aware of this waste generation rate to adequately address and manage the waste produced, whether it be through recycling programs, waste reduction initiatives, or proper disposal methods. (source: BS 5906)

Managing waste generated by buildings and industrial infrastructures is a topic of increasing concern due to its environmental and economic impact. To address these concerns, Facilities Management service teams oversee the stages of waste management that arise during civil infrastructure projects, including construction, deconstruction, demolition, building systems operations, maintenance, and disposal. Achieving efficient waste management requires a comprehensive understanding of local rules and regulations and a science- and technology-based approach.

This article provides a comprehensive overview of the classification of waste generation, the control tools, and the reporting framework necessary for effective waste management in facilities management. By setting facility-specific guidelines, Facilities Managers can ensure that waste is managed responsibly and sustainably, thus minimising its adverse environmental impact and promoting economic efficiency.

Some interesting facts about the Global Waste Management

Waste Management Operating Process Gaps – Causes, Impacts, and Control Measures.

Efficient waste management is a critical aspect of sustainable environmental management. Complying with regulatory frameworks, implementing best practices in business operations, and understanding the technical know-how to manage waste effectively is imperative. By adopting these measures, we can work towards building a cleaner and greener future.

Challenges in transitioning to green janitorial services from conventional cleaning

Let us begin with a few interesting facts about Janitorial Services and Environmental Health.

Why Green Janitorial Service is essential to business?

Post-pandemic, facility occupants across Gen X, Y (Millennial), and ‘Zers are conscious of business operating practices that adversely impact health and environmental ecosystems. Beyond the need for compliance with local statutory and regulatory guidelines, investors, brand image for social responsibilities, and overall optimised business operating costs call for operating practices enhancing health and environment protection measures. Transition to Green Janitorial service from the conventional regime is given for business image and sustainability.

Economic, Social and Governance Drivers for Green Janitorial Service –

Successfully implementing a Green Cleaning regime requires overcoming common challenges.

To overcome the challenges listed, it is essential to design and implement tailored solutions that meet the unique requirements of each building’s application, including Energy Efficiency Assessment, Building Carbon Footprint Assessment, and Building Indoor Environment Quality Services.

Policy, Processes, Practice, and Profit

Policy, practice, and profit are critical elements of an environmentally friendly janitorial service regime.

Policy

Developing policies aligned with ‘Environmental Sustainability’ principles and complying with Green Cleaning standards, such as GS-42 or other equivalents, is essential to fostering an environment-friendly Facilities Management service. The successful implementation of sustainability objectives can be determined by a Service Level Agreement (SLA) with service providers for a commercial or institutional building, encompassing Energy Efficiency Assessment, Building Carbon Footprint Assessment, and Building Indoor Environment Quality Services.

Processes and Practices

A robust janitorial plan requires a governing standard and effective process. This ensures a clean, safe, organised space that promotes productivity and well-being. Developing site-specific processes, adapting them, and standardising critical elements of janitorial services is crucial for ensuring the best outcomes, including Energy Efficiency Assessment, Building Carbon Footprint Assessment, and Building Indoor Environment Quality Services.

As a good practice, when procuring cleaning materials, priority should be given to those that adhere to environmentally friendly guidelines and standards. Only cleaning products certified by globally recognised ecolabel certification programs, such as the Eco Global Label (NSO-NAP 3 standard), Green Seal Environmental Standard for Cleaning Services (GS-42) or EU Ecolabel, should be used. These products must be certified by a recognised institute for easy reference and verification. At least 75% of general-purpose cleaning items should be approved for environmentally safe usage, aligning with Energy Efficiency Assessment, Building Carbon Footprint Assessment, and Building Indoor Environment Quality Services.

When purchasing cleaning equipment, consider eco-friendly options and gradually replace high-impact equipment by assessing its carbon footprint and emissions, in line with Energy Efficiency Assessment, Building Carbon Footprint Assessment, and Building Indoor Environment Quality Services.

Profit

Cost is a paramount factor when considering the transition from traditional cleaning methods to eco-friendly alternatives. Specifically, labour, consumables, implements, and equipment comprise 75%, 15%, and 10% of the total cost of janitorial services. The optimisation of person-hour costs can be achieved through proper training, upskilling, and the efficient application of tools and equipment. Monitoring and analysing industry benchmarks and the facility’s baseline throughout the transitioning process will optimise the usage of cleaning agents. Waste treatment to upcycle or recycle contributes to operational earnings, supporting Energy Efficiency Assessment, Building Carbon Footprint Assessment, and Building Indoor Environment Quality Services.

An efficient green cleaning program must be tailored to the facility’s needs, and the outlined steps will result in a successful transition while keeping costs in check, incorporating Energy Efficiency Assessment, Building Carbon Footprint Assessment, and Building Indoor Environment Quality Services.

Comparison of cleaning agents between conventional and green cleaning methods.

Budgeting for Facility Managers

Why should Facility Managers be aware of the Planning Operations Budget?

Facility Managers must create an accurate budget plan that meets business objectives and stakeholders’ expectations. They need to understand financial tools, local markets, and management priorities. An effective budget plan is essential for resource allocation, cost control, transparent communication with stakeholders, and cost allocation to critical service lines.

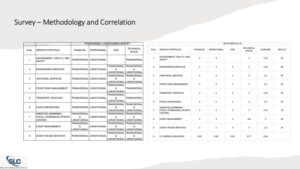
This article comprehensively explains the different approaches to preparing an Annual Budget for Integrated Facilities Operations to facilitate informed decision-making. The primary objective of the Annual Budget is to meet building infrastructure needs while safeguarding stakeholders’ financial interests. The Annual Budget can be categorised into Operation and Capital expenditures, and it is crucial to draft it in adherence to the Service Level Agreement (SLA), using industry-specific methodologies while considering business risk ownership, cost incentives, and impacts. Therefore, it is imperative to carefully consider all factors before finalising the Annual Budget.

  • Fixed Price
  • Variable Price
  • Guaranteed Maximum Price
  • Cost plus
  • Pass through
  • Performance-based
  • Rolling Forecast Budgeting

To establish a dependable baseline for operational expenses, it is imperative to conduct an analysis of both day 0 estimation and past trends of operating spending. In addition, it is vital to consider industry benchmarks, revenue, and functional requirements. This comprehensive approach will allow for an accurate and realistic assessment of operational expenses, which is crucial for effective financial management. By utilising these factors, businesses can optimise their spending, identify areas of potential cost savings, and make informed decisions regarding their financial strategy. Therefore, it is highly recommended that organisations prioritise the analysis of these variables when creating an operational spending baseline.

  • Fixed Price

The fixed price elements usually include monthly fixed maintenance charges (— /sqm) and other mandatory costs stipulated in the Service Level Agreement.

  • Variable Price

The category of Variable Price for service line elements entails annual costs that vary depending on occupancy, business operations, seasonal changes, occupants’ needs, and other independent variables. Statistical tools and science-based initiatives are employed to accurately predict costs and cost performance indicators, utilising past trending information, including anticipated inflation. This approach enables organisations to determine the optimal allocation of resources and enhance overall cost-effectiveness.

Example-

Monthly Energy Consumption (MWh) = b0 + b1x1 + b2x2 + b3x3 + e

Independent variables – x1, x2, x3

Constants – b0, b1, b2, b3

Residual – e

It is imperative to consider the derived value of the ‘significance F’ and P to ensure the fitness of independent variables in regression analysis. It is recommended that these values be maintained below 0.05 (< .05) to ensure the accuracy of the analysis. It is imperative to evaluate the p-values associated with the independent variables: the average monthly temperature in an outdoor setting, monthly footfall within the building, and business operating hours.

Example – Linear Regression Analysis

(The ‘Footfall/month’ P-value in the building is greater than 0.05, so it is not considered in the revised energy consumption projection.)

  • Guaranteed Maximum Price (GMP), Cost Plus (CP), and Pass-through (PT)

A service-level agreement defines the pricing mechanism for service line elements based on GMP, CP, or PT.

The GMP approach calls for applying statistical tools with due consideration of the client business operating culture, operations efficiency, industry benchmarks, local demographic influences, other independent contributing factors, and customer satisfaction survey outcomes. GMP will include both ‘Fixed’ and ‘Variable’ budgeted estimates within the mandated Guaranteed Maximum Pricing. The absorption costs attributable to prevailing CPI beyond the inflation threshold must also be factored into the GMP estimation.

Example  

The cost adjustment is determined by considering the annual CPI inflation rate, which typically falls between 2% and 3%. Furthermore, a budgetary adjustment of 1% is also taken into account.

Various auxiliary services such as Medical Center, Training, specialised Cleaning, Catering, Event Management, Procurement, and Transport can be classified under the CP and PT categories. Adopting a Zero-based budgeting approach is highly recommended for projects under the cost-plus category. In the event of proposing new initiatives, it is essential to provide a Capital Investment Note that adequately addresses issues pertinent to the capital requirement and sourcing, Return on Capital employed (average of year 1-3), and financial sensitivity analysis, such as IRR, NPV, or EBIT margin. Ensuring that the Capital Investment Note includes a thorough economic sensitivity analysis to assess the feasibility, risk management, and potential profitability is crucial.

  • Performance-based

The performance-based budgeting process is strategically designed to motivate the accomplishment of business objectives, including innovation, improvement, and cost optimisation within an organisation. Establishing service level agreements (SLAs) with measurable performance indexes, outcome-based rewards, and penalties for service providers is a significant component of this approach. This methodology allows organisations to align their budgetary planning with their overall business objectives, ensuring that all stakeholders work toward a common purpose and that resources are allocated effectively. Implementing performance-based budgeting can help organisations achieve their long-term goals while promoting transparency and accountability.

  • Rolling Forecast Budgeting

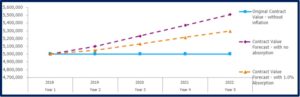
The rolling forecasting model represents a valuable tool for change management processes in budget planning. This method considers the impact of market pricing fluctuations and the reallocation of budgeted amounts to priority cost heads. Such estimates are obtained through a meticulous application of statistical and financial techniques. The model holds great promise in optimising budgetary allocations, ensuring their efficacy, and contributing to sound decision-making practices.

  • Common pitfalls in ‘Annual Budget Planning’

Successfully planning an annual budget necessitates a comprehensive understanding of financial tools, management expectations, and objectives. To avoid common errors, meticulous attention to assumptions and estimations, diligent monitoring of expenses, continuous analysis of expenditure trends, end-use feedback gathering, and periodic assessment of the ‘Facility Condition Index’ are required.

Common pitfalls in this process include deficient forecasting due to inadequate historical expenditure data and prevailing market pricing, alterations in business operations throughout the financial year, insufficient contingency amounts, poor communication and collaboration among stakeholders, and inadequate comprehension of operational sustainability.


Carbon Performance Assessment

The reporting of greenhouse gas emissions (GHG) is gaining prominence among corporate stakeholders due to various factors, including regulatory compliance, investment considerations, and voluntary initiatives to protect the environment and enhance brand image. During the operations and maintenance, the Facility Management team is entrusted with monitoring, tracking, and improving the organisation’s carbon footprint annually. To this end, the team is tasked with deploying effective strategies to meet the organisation’s carbon reduction targets while ensuring that all relevant stakeholders are informed and engaged. By adopting best practices and leveraging their expertise, the Facility Management team can help the organisation achieve its environmental objectives while enhancing its reputation as a responsible corporate citizen.

To identify areas for improvement, Facility Management teams must understand greenhouse gas emissions, estimation tools, and maintenance practices. In this context, basic activity data templates are presented to assist in clarifying and implementing these concepts.

Scope 1, 2, and 3 emissions

Scope 1 emissions

Activity data from the Facility

 Energy from Captive Power Generating Station

 Annual CO2e (kg) emissions from Building Airconditioning equipment

Activity data – Annual HFC and PFC emissions from cooling equipment operations

Case Study : Carbon Management